
Work
I’ve been embedded at Marsh McLennan through Solugenix for six years. Six things I shipped there.
Claude in the daily workflow
I build with Claude and VS Code every day, and I've written custom skills and agents around our codebase so the team's conventions are followed by default. The architecture, the trade-offs and the final review stay with me.
-
15 daysfrom idea to a working MVP, and 45 days to full production
A chatbot that answers with charts
People ask questions in plain language across data covering over 6 million client locations, and get interactive charts and tables back rather than plain text. I vectorized the business data in PostgreSQL with pgvector, retrieved relevant records through semantic search, and passed that context to an LLM.
-
60%faster data transfer
Event-driven data for location intelligence
I introduced Kafka-based processing for location intelligence and moved REST payloads to Avro protocol buffers.
-
50%less feature development time
One component framework for the whole account
I designed the shared Angular framework that multiple teams adopted. It cut feature development time by half and standardized UI patterns across the account.
-
Tableau, replacedlower licensing and operational costs
Maps for live catastrophe events
I architected the replacement of Tableau with a Leaflet.js and ESRI mapping platform with real-time clustering, hazard tracking and interactive risk visualization. Before that I built real-time storm and wildfire tracking with ESRI layers and GIS data, so analysts could assess impact zones and estimate financial exposure while events were still unfolding.
-
3 monthsinstead of the six that were estimated
Replacing a vendor’s table load
I replaced the Unqork table load process with a custom Angular web component. That halved the delivery estimate and removed our dependence on an external vendor’s roadmap.
-
70%less manual reporting effort
Reports on demand
I built a NestJS service that generates PowerPoint reports on demand and delivers them through AWS S3.
Path
More than 9 years building and delivering enterprise software for Fortune 500 clients.
-
Lead Software Engineer
Solugenix, onsite at Marsh McLennan. Phoenix, AZ
Jul 2023 – present
Onsite technical lead. I lead and mentor six engineers across onshore and offshore locations, and build in React, NestJS and Python (FastAPI) alongside the established Angular platform.
-
Senior Software Engineer
Solugenix. Hyderabad, then Phoenix, AZ
Oct 2019 – Jul 2023
Built real-time storm and wildfire tracking with ESRI layers and GIS data. Relocated from Hyderabad to Phoenix to lead front-end architecture onsite, then promoted to lead.
-
Senior Software Engineer
Airbus. India
Jul 2019 – Oct 2019
Worked on the Angular 7 rebuild of the Airbus Flight Test Application (FTANG), replacing a legacy Ext JS system.
-
Full Stack Developer
IBM. India
Apr 2016 – Jul 2019
Built the UCC Portal for Airtel subscribers and consolidated three admin applications into a single unified GUI.
-
Bachelor of Engineering
K L University. India
2015
SayShape, a side project
Outside work I build SayShape, an open-source UI language that AI models write, and the engine that draws it. A model streams a few lines of a compact spec and a working interface appears while it is still writing; the spec is never executed as code. MIT licensed, version 0.1, and still an early prototype.
In my own small comparison (7 tasks, answered by Claude Sonnet 5.5, November 2026), a screen took a median of 171 output tokens in SayShape against 1,299 in HTML. That measures only the model’s output, not drawing time, and varies by task and model.
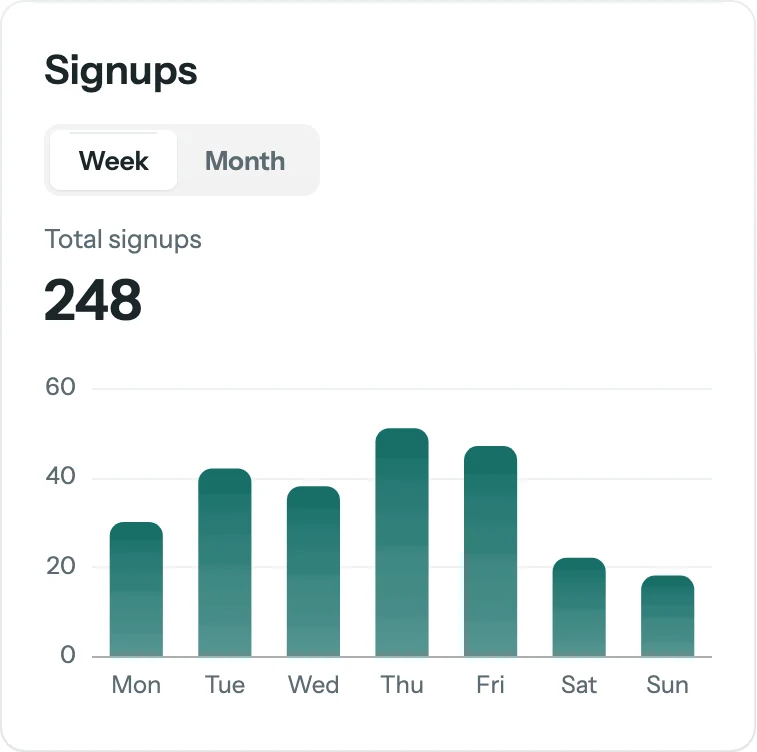
One request, answered by Claude Sonnet 5.5 and drawn by SayShape. Under the lens: the spec the model wrote for it, line by line where each line lands.
The spec, as the model wrote it:
state view="Week" week=[{label: "Mon", signups: 30}, {label: "Tue", signups: 42}, {label: "Wed", signups: 38}, {label: "Thu", signups: 51}, {label: "Fri", signups: 47}, {label: "Sat", signups: 22}, {label: "Sun", signups: 18}] month=[{label: "Week 1", signups: 210}, {label: "Week 2", signups: 245}, {label: "Week 3", signups: 230}, {label: "Week 4", signups: 268}]
derive shown={view == 'Week' ? week : month}
card
  text "Signups" style=title
  segmented bind=view options="Week,Month"
  stat label="Total signups" value={number(sum(shown, 'signups'))}
  chart kind=bar items=shown x=label y=signups format=number